Journals > > Topics > Remote Sensing and Sensors
Remote Sensing and Sensors|450 Article(s)
Nighttime Tiny Fire Recognition Algorithm by Joint Low-Light-Assisted Infrared Remote Sensing Data
Hui Liu, Yuqing He, Xiuqing Hu, and Chunli Sun
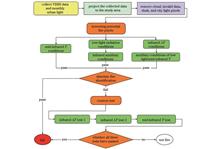
ObjectiveThe conventional recognition of nighttime fires typically relies on infrared brightness temperature data, which often presents issues such as limited accuracy and challenges in identifying small fires. On the other hand, low-light detectors excel at capturing bright targets in settings of low illumination or during night conditions, making their observational data a valuable supplement to nighttime fire recognition. Consequently, the integration of low-light-assisted infrared technology in nighttime fire recognition holds considerable research significance. In this context, we introduce a novel fire recognition algorithm named FRJLI (nighttime tiny fires recognition by joint low-light-assisted infrared remote sensing data). This algorithm aims to integrate low-light data that eliminates interference from urban lights into fire recognition processes and establish thresholds for both low-light and infrared data to enhance the detection accuracy of small nighttime fires.MethodsGiven the heightened intensity and destructiveness of forest and grassland fires compared to fires in other vegetation types, our investigation delves into the atypical behavior exhibited by the visible infrared imaging radiometer suite (VIIRS) data within the medium-resolution infrared channel (M-band) and the low-light channel (DNB) of the U.S. Next Generation Meteorological and Environmental Satellite (NPP) when facing forest and grassland fires. Our methodology involves fusing VIIRS DNB data to extract monthly city light background information, projecting both M-band and DNB data simultaneously to the study area, preprocessing the projected remote sensing data to derive standardized data, and executing multiband threshold discrimination, absolute fire recognition, and contextual discrimination on the processed data to culminate in a comprehensive joint low-light and infrared nighttime fire recognition process.Results and DiscussionsBy implementing the FRJLI algorithm on forest fire in the Republic of Korea and grassland fire in Mongolia, we daily map out the distribution areas of these fires (Fig. 5). Our evaluation process focuses on two key aspects: first, a false color image that integrates low-light radiation values with mid-infrared brightness temperatures; second, the utilization of vegetation indices for a more accurate depiction of the affected fire zones. Ensuring the accuracy of our recognition outcomes, we visually compare the recognition results obtained through the FRJLI algorithm with those yielded by the NASA official algorithm, the MODIS Collection4 algorithm, and the FILDA algorithm (Fig. 9). The FRJLI algorithm demonstrates remarkable consistency with the identification outcomes and false color imagery, enabling the detection of minor fires at the fire line periphery. In a detailed analysis, the identification results from all four algorithms are scrutinized in terms of quantity and area coverage (Fig. 10). The findings affirm that the FRJLI algorithm not only identifies a greater number of fires but also offers superior quality compared to other methods, thus providing crucial technical support for more efficient and precise fire detection processes. Furthermore, an innovative examination of the correlation and sensitivity discrepancies between low-light and infrared data in the daily identification of fires is provided (Fig. 12).This analysis confirms the general patterns observed in fires, validates the trend accuracy of the FRJLI algorithm’s identification outcomes, and highlights its ability to identify colder and smaller fires in contrast to NASA’s findings. Significantly, this study concludes that low-light data is more responsive to the fire’s burning status, while infrared data is more adept at revealing fire trends, showcasing the FRJLI algorithm’s capability to leverage the complementary strengths of low-light and infrared fire detection techniques. Finally, through the insights gleaned, we speculate on and verify the varying states of fire identification achieved by the FRJLI algorithm (Figs. 14 & 15). These figures vividly portray the algorithm’s advantages in accurately identifying fire quantities, pinpointing fire centers and boundaries, as well as capturing critical trends in fire-related data.ConclusionsTaking into account the peculiar behavior exhibited in mid-infrared brightness temperature, the discrepancy in mid-infrared and long-wave infrared brightness temperatures, and variations in low-light radiation values during fires, we leverage the available data to introduce a novel algorithm for nocturnal tiny fire recognition through joint low-light-assisted infrared technology. Our methodology involves merging monthly city light data with low-light information to mitigate city light interference in low-light fire detection. By leveraging both low-light and infrared data concurrently for fire recognition, we aim to enhance the detection accuracy of small fires, including those concealed in shaded areas. Experimental validation is performed on forest fire occurring in March 2022 in the Republic of Korea and grassland fire in April 2022 in Mongolia, successfully enabling the identification of colder and smaller fires. The proposed algorithm significantly advances the capability to detect these colder and smaller fires, thereby enhancing the quantity and quality of nighttime fire recognition. Furthermore, it offers more precise and timely insights into fire location, fire center coordinates, fire line positions, and trend analysis, making it particularly valuable for forest and grassland resource protection applications. This innovative approach holds immense potential and practical value in bolstering fire management strategies for forest and grassland ecosystems. ObjectiveThe conventional recognition of nighttime fires typically relies on infrared brightness temperature data, which often presents issues such as limited accuracy and challenges in identifying small fires. On the other hand, low-light detectors excel at capturing bright targets in settings of low illumination or during night conditions, making their observational data a valuable supplement to nighttime fire recognition. Consequently, the integration of low-light-assisted infrared technology in nighttime fire recognition holds considerable research significance. In this context, we introduce a novel fire recognition algorithm named FRJLI (nighttime tiny fires recognition by joint low-light-assisted infrared remote sensing data). This algorithm aims to integrate low-light data that eliminates interference from urban lights into fire recognition processes and establish thresholds for both low-light and infrared data to enhance the detection accuracy of small nighttime fires.MethodsGiven the heightened intensity and destructiveness of forest and grassland fires compared to fires in other vegetation types, our investigation delves into the atypical behavior exhibited by the visible infrared imaging radiometer suite (VIIRS) data within the medium-resolution infrared channel (M-band) and the low-light channel (DNB) of the U.S. Next Generation Meteorological and Environmental Satellite (NPP) when facing forest and grassland fires. Our methodology involves fusing VIIRS DNB data to extract monthly city light background information, projecting both M-band and DNB data simultaneously to the study area, preprocessing the projected remote sensing data to derive standardized data, and executing multiband threshold discrimination, absolute fire recognition, and contextual discrimination on the processed data to culminate in a comprehensive joint low-light and infrared nighttime fire recognition process.Results and DiscussionsBy implementing the FRJLI algorithm on forest fire in the Republic of Korea and grassland fire in Mongolia, we daily map out the distribution areas of these fires (Fig. 5). Our evaluation process focuses on two key aspects: first, a false color image that integrates low-light radiation values with mid-infrared brightness temperatures; second, the utilization of vegetation indices for a more accurate depiction of the affected fire zones. Ensuring the accuracy of our recognition outcomes, we visually compare the recognition results obtained through the FRJLI algorithm with those yielded by the NASA official algorithm, the MODIS Collection4 algorithm, and the FILDA algorithm (Fig. 9). The FRJLI algorithm demonstrates remarkable consistency with the identification outcomes and false color imagery, enabling the detection of minor fires at the fire line periphery. In a detailed analysis, the identification results from all four algorithms are scrutinized in terms of quantity and area coverage (Fig. 10). The findings affirm that the FRJLI algorithm not only identifies a greater number of fires but also offers superior quality compared to other methods, thus providing crucial technical support for more efficient and precise fire detection processes. Furthermore, an innovative examination of the correlation and sensitivity discrepancies between low-light and infrared data in the daily identification of fires is provided (Fig. 12).This analysis confirms the general patterns observed in fires, validates the trend accuracy of the FRJLI algorithm’s identification outcomes, and highlights its ability to identify colder and smaller fires in contrast to NASA’s findings. Significantly, this study concludes that low-light data is more responsive to the fire’s burning status, while infrared data is more adept at revealing fire trends, showcasing the FRJLI algorithm’s capability to leverage the complementary strengths of low-light and infrared fire detection techniques. Finally, through the insights gleaned, we speculate on and verify the varying states of fire identification achieved by the FRJLI algorithm (Figs. 14 & 15). These figures vividly portray the algorithm’s advantages in accurately identifying fire quantities, pinpointing fire centers and boundaries, as well as capturing critical trends in fire-related data.ConclusionsTaking into account the peculiar behavior exhibited in mid-infrared brightness temperature, the discrepancy in mid-infrared and long-wave infrared brightness temperatures, and variations in low-light radiation values during fires, we leverage the available data to introduce a novel algorithm for nocturnal tiny fire recognition through joint low-light-assisted infrared technology. Our methodology involves merging monthly city light data with low-light information to mitigate city light interference in low-light fire detection. By leveraging both low-light and infrared data concurrently for fire recognition, we aim to enhance the detection accuracy of small fires, including those concealed in shaded areas. Experimental validation is performed on forest fire occurring in March 2022 in the Republic of Korea and grassland fire in April 2022 in Mongolia, successfully enabling the identification of colder and smaller fires. The proposed algorithm significantly advances the capability to detect these colder and smaller fires, thereby enhancing the quantity and quality of nighttime fire recognition. Furthermore, it offers more precise and timely insights into fire location, fire center coordinates, fire line positions, and trend analysis, making it particularly valuable for forest and grassland resource protection applications. This innovative approach holds immense potential and practical value in bolstering fire management strategies for forest and grassland ecosystems.
Acta Optica Sinica
- Publication Date: Apr. 25, 2024
- Vol. 44, Issue 8, 0828001 (2024)

Gas Sensor Based on Graphene Oxide-Coated Hollow Microbubble Whisper Gallery Resonant Mode
Yize Liu, Junfeng Jiang, Kun Liu, Shuang Wang, Yixuan Wang, Xin Chen, and Tiegen Liu
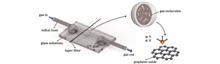
ObjectiveThe trace gas direction holds practical significance in human health, industrial production safety, national defense, and other key fields. The optical fiber whisper gallery mode (WGM) sensors can achieve high sensitivity and resolution sensing measurement due to their strong light-matter interaction. However, the common silica material of WGM sensors is not sensitive to gases, which limits their applications in gas sensing. As a kind of two-dimensional material, graphene oxide (GO) not only has sound physical properties such as high mechanical strength and flexibility, but also features a significant surface volume ratio, efficient surface adsorption, low noise level, and stable chemical properties. Based on optical WGM excitation, the GO film is coated on a hollow microsphere cavity inwall to achieve gas sensing. The gas molecule adsorption on the GO will affect the effective refractive index of the overall microcavity structure and be reflected by the WGM shift. It is worth noting that the unique hollow structure of the microbubble is a natural fluid channel, which is very suitable for gas transportation. It is unnecessary to design a separate fluid channel or external gas chamber.MethodsThe investigation is based on the WGM sensor theory. The changed refractive index induced by gas molecular adsorption is analyzed. The sensors are fabricated by melt pressured rheological method and injection of GO dispersion. First, the performance of the GO-coated WGM gas sensor is investigated, and the changes in WGM resonance wavelength are observed by injecting gases with different concentrations into the sensor. Next, the gas sensing performance below 40×10-6 is elaborately investigated. The sensitivity and resolution of the sensor are obtained. Finally, the real-time response to 10×10-6-40×10-6 NH3 is demonstrated to show the sound recoverability, response, and recovery time.Results and DiscussionsThe designed GO-coated microbubble sensor exhibits deserved gas sensing performance. Fig. 4 shows the WGM spectrum of the structure with different gas concentrations. The resonance wavelength appears to be red-shifted as the gas concentration increases, and this trend is gradually slowing down. The optical quality factor Q is 3.7×10⁵. Specifically, for the low concentrations from 0 to 40×10-6, the sensitivity is 0.73×10⁶ pm with a fitting coefficient of 0.9994 (Fig. 5). According to the standard deviation of center wavelength fluctuations, detection resolution of the gas sensor is better than 1.9×10⁻⁶. The temperature response performance is shown in Fig. 6, and the response is 10.88 pm/℃. Finally, the time response of the gas sensor at low concentrations is shown in Fig. 7. At the concentration of 20×10-6, the response time and recovery time are 294 s and 329 s respectively.ConclusionsWe design a kind of gas sensor based on a GO-coated microbubble. The gas molecule adsorption affects the refractive index of GO and changes the overall effective refractive index of the microcavity sensor correspondingly. Gas sensing can be achieved by monitoring the WGM shifts via a power meter. The sensors are fabricated by melt pressurized stretching and injection of GO dispersion. The sensitivity is 0.73×10⁶ pm within a gas concentration below 40×10-6. According to the wavelength drift standard deviation of the overall system, the resolution is 1.9×10⁻⁶. At the gas concentration of 20×10-6, the response time and recovery time of the sensor are 294 s and 329 s respectively. Meanwhile, the hollow sensor structure does not need additional gas channels or gas chamber packaging structures during gas sensing, thus providing convenience for practical applications. ObjectiveThe trace gas direction holds practical significance in human health, industrial production safety, national defense, and other key fields. The optical fiber whisper gallery mode (WGM) sensors can achieve high sensitivity and resolution sensing measurement due to their strong light-matter interaction. However, the common silica material of WGM sensors is not sensitive to gases, which limits their applications in gas sensing. As a kind of two-dimensional material, graphene oxide (GO) not only has sound physical properties such as high mechanical strength and flexibility, but also features a significant surface volume ratio, efficient surface adsorption, low noise level, and stable chemical properties. Based on optical WGM excitation, the GO film is coated on a hollow microsphere cavity inwall to achieve gas sensing. The gas molecule adsorption on the GO will affect the effective refractive index of the overall microcavity structure and be reflected by the WGM shift. It is worth noting that the unique hollow structure of the microbubble is a natural fluid channel, which is very suitable for gas transportation. It is unnecessary to design a separate fluid channel or external gas chamber.MethodsThe investigation is based on the WGM sensor theory. The changed refractive index induced by gas molecular adsorption is analyzed. The sensors are fabricated by melt pressured rheological method and injection of GO dispersion. First, the performance of the GO-coated WGM gas sensor is investigated, and the changes in WGM resonance wavelength are observed by injecting gases with different concentrations into the sensor. Next, the gas sensing performance below 40×10-6 is elaborately investigated. The sensitivity and resolution of the sensor are obtained. Finally, the real-time response to 10×10-6-40×10-6 NH3 is demonstrated to show the sound recoverability, response, and recovery time.Results and DiscussionsThe designed GO-coated microbubble sensor exhibits deserved gas sensing performance. Fig. 4 shows the WGM spectrum of the structure with different gas concentrations. The resonance wavelength appears to be red-shifted as the gas concentration increases, and this trend is gradually slowing down. The optical quality factor Q is 3.7×10⁵. Specifically, for the low concentrations from 0 to 40×10-6, the sensitivity is 0.73×10⁶ pm with a fitting coefficient of 0.9994 (Fig. 5). According to the standard deviation of center wavelength fluctuations, detection resolution of the gas sensor is better than 1.9×10⁻⁶. The temperature response performance is shown in Fig. 6, and the response is 10.88 pm/℃. Finally, the time response of the gas sensor at low concentrations is shown in Fig. 7. At the concentration of 20×10-6, the response time and recovery time are 294 s and 329 s respectively.ConclusionsWe design a kind of gas sensor based on a GO-coated microbubble. The gas molecule adsorption affects the refractive index of GO and changes the overall effective refractive index of the microcavity sensor correspondingly. Gas sensing can be achieved by monitoring the WGM shifts via a power meter. The sensors are fabricated by melt pressurized stretching and injection of GO dispersion. The sensitivity is 0.73×10⁶ pm within a gas concentration below 40×10-6. According to the wavelength drift standard deviation of the overall system, the resolution is 1.9×10⁻⁶. At the gas concentration of 20×10-6, the response time and recovery time of the sensor are 294 s and 329 s respectively. Meanwhile, the hollow sensor structure does not need additional gas channels or gas chamber packaging structures during gas sensing, thus providing convenience for practical applications.
Acta Optica Sinica
- Publication Date: Apr. 10, 2024
- Vol. 44, Issue 7, 0728004 (2024)
Simulation and Experimental Research on Fiber-Optic Dynamic Pressure Sensor Based on a Fiber-Tip Film-Type Fabry-Perot Cavity
Xiongxing Zhang, Zhe Sun, Xueqing Zhao, Zihao Gao, Xiaojun Feng, Wen Pan, and Haibin Chen
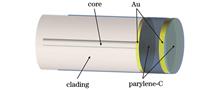
ObjectiveShock wave is a kind of compression wave in which the wavefront propagates in the form of a synoptic surface in an elastic medium. Its typical feature is the discontinuous abrupt changes of state parameters of the medium on the abrupt surface, such as pressure, density, and temperature. As the study of shock waves progresses, it has been found that shock wave technology has great civilian value, so the measurement of shock wave signals has become increasingly important. The formation and propagation of shock waves are accompanied by overpressure and rapid changes in pressure. The response speed and reliability of the corresponding pressure sensors have more demanding requirements. Traditional electrical shock wave pressure sensors are susceptible to electromagnetic interference, temperature range tolerance, rise time, and other issues, which limit the application of such sensors. Fiber-optic Fabry-Perot (F-P) pressure sensors, as an important branch of fiber-optic sensors, provide new possibilities for dynamic pressure measurement of shock waves due to their advantages of fast response speed, high sensitivity, small size, and high resistance to electromagnetic interference. To achieve the dynamic pressure measurement of shock waves, a thin-film fiber-optic F-P pressure sensor with a fiber-tip coating is studied.MethodsThe basic structure of the thin-film fiber-optic F-P sensor studied in this paper mainly consists of two gold films with different thicknesses, a layer of parylene film serving as the F-P cavity, and a single-mode optical fiber for optical field coupling. When the shock wave pressure was applied to the end surface of the sensor, the parylene film was subjected to pressure, and deformation was produced, causing a change in the F-P cavity length. This change in length then affected the interference of reflected light produced by the two gold films on the front and back surfaces of the F-P cavity. Before the sensor was fabricated, the optical and mechanical aspects of the sensor were simulated using finite element simulation software, and the performance of the sensor under different parameters was calculated by combining theoretical formulas. In addition, the parameters of the sensor were determined. After the sensor was fabricated, the static and dynamic pressure measurement system was designed and constructed, and the experimental results were analyzed.Results and DiscussionsIn the pressure range of 0-60 MPa, a static pressure measurement experiment is conducted on a thin-film fiber-optic F-P pressure sensor using a bench-top oil pressure pump. The reflected spectrum signal of the sensor is obtained and processed to calculate the cavity length of the F-P cavities of different pressure sensors. From the reflectance spectrum curves (Fig. 12) of the wavelength and corresponding light intensity under different pressures, it can be seen that with increasing pressure, the overall reflectance spectrum of the sensor drifts to the left. Based on the wave valley values at different pressures, the length information of the sensor cavity corresponding to the pressure is calculated (Fig. 13), yielding wavelength sensitivity and cavity length sensitivity of the sensor of 0.0809 nm/MPa and 0.3200 nm/MPa, respectively, which are consistent with the simulation results. In the dynamic pressure measurement experiments, the sensor successfully captures the shock wave signal with a peak pressure of 7.47 MPa and a rise time of 75 ns (Fig. 15).ConclusionsFor measuring shock wave signals, we propose a thin-film fiber-optic F-P pressure sensor. The effective structure of the sensor is a three-layer structure consisting of gold film, polymer film, and gold film. By utilizing the change of the peak position of the sensor's reflected spectral wave, the sensor causes a change of spectral intensity, so as to realize the measurement of the signal pressure. In the pressure measurement range of 0-60 MPa, the wavelength sensitivity is 0.0809 nm/MPa, and the cavity length sensitivity is 0.3200 nm/MPa. Within the range of dynamic pressure measurement, the sensor can measure the dynamic signals with a pressure rise time of 75 ns and a pressure rise amplitude of 7.41 MPa. The experimental results show that the sensor has a large range of pressure measurement ability and high sensitivity, and it has a small size, light weight, and anti-electromagnetic interference. Therefore, the sensor has greater application prospects in the field of shock wave pressure measurement. ObjectiveShock wave is a kind of compression wave in which the wavefront propagates in the form of a synoptic surface in an elastic medium. Its typical feature is the discontinuous abrupt changes of state parameters of the medium on the abrupt surface, such as pressure, density, and temperature. As the study of shock waves progresses, it has been found that shock wave technology has great civilian value, so the measurement of shock wave signals has become increasingly important. The formation and propagation of shock waves are accompanied by overpressure and rapid changes in pressure. The response speed and reliability of the corresponding pressure sensors have more demanding requirements. Traditional electrical shock wave pressure sensors are susceptible to electromagnetic interference, temperature range tolerance, rise time, and other issues, which limit the application of such sensors. Fiber-optic Fabry-Perot (F-P) pressure sensors, as an important branch of fiber-optic sensors, provide new possibilities for dynamic pressure measurement of shock waves due to their advantages of fast response speed, high sensitivity, small size, and high resistance to electromagnetic interference. To achieve the dynamic pressure measurement of shock waves, a thin-film fiber-optic F-P pressure sensor with a fiber-tip coating is studied.MethodsThe basic structure of the thin-film fiber-optic F-P sensor studied in this paper mainly consists of two gold films with different thicknesses, a layer of parylene film serving as the F-P cavity, and a single-mode optical fiber for optical field coupling. When the shock wave pressure was applied to the end surface of the sensor, the parylene film was subjected to pressure, and deformation was produced, causing a change in the F-P cavity length. This change in length then affected the interference of reflected light produced by the two gold films on the front and back surfaces of the F-P cavity. Before the sensor was fabricated, the optical and mechanical aspects of the sensor were simulated using finite element simulation software, and the performance of the sensor under different parameters was calculated by combining theoretical formulas. In addition, the parameters of the sensor were determined. After the sensor was fabricated, the static and dynamic pressure measurement system was designed and constructed, and the experimental results were analyzed.Results and DiscussionsIn the pressure range of 0-60 MPa, a static pressure measurement experiment is conducted on a thin-film fiber-optic F-P pressure sensor using a bench-top oil pressure pump. The reflected spectrum signal of the sensor is obtained and processed to calculate the cavity length of the F-P cavities of different pressure sensors. From the reflectance spectrum curves (Fig. 12) of the wavelength and corresponding light intensity under different pressures, it can be seen that with increasing pressure, the overall reflectance spectrum of the sensor drifts to the left. Based on the wave valley values at different pressures, the length information of the sensor cavity corresponding to the pressure is calculated (Fig. 13), yielding wavelength sensitivity and cavity length sensitivity of the sensor of 0.0809 nm/MPa and 0.3200 nm/MPa, respectively, which are consistent with the simulation results. In the dynamic pressure measurement experiments, the sensor successfully captures the shock wave signal with a peak pressure of 7.47 MPa and a rise time of 75 ns (Fig. 15).ConclusionsFor measuring shock wave signals, we propose a thin-film fiber-optic F-P pressure sensor. The effective structure of the sensor is a three-layer structure consisting of gold film, polymer film, and gold film. By utilizing the change of the peak position of the sensor's reflected spectral wave, the sensor causes a change of spectral intensity, so as to realize the measurement of the signal pressure. In the pressure measurement range of 0-60 MPa, the wavelength sensitivity is 0.0809 nm/MPa, and the cavity length sensitivity is 0.3200 nm/MPa. Within the range of dynamic pressure measurement, the sensor can measure the dynamic signals with a pressure rise time of 75 ns and a pressure rise amplitude of 7.41 MPa. The experimental results show that the sensor has a large range of pressure measurement ability and high sensitivity, and it has a small size, light weight, and anti-electromagnetic interference. Therefore, the sensor has greater application prospects in the field of shock wave pressure measurement.
Acta Optica Sinica
- Publication Date: Apr. 10, 2024
- Vol. 44, Issue 7, 0728003 (2024)
Development of Fiber-Optic Acoustic Sensors with Silicon-Based MEMS Wheel-Shaped Diaphragm for Mini-Unmanned Aerial Vehicle Detection
Kangning Ji, Xinyu Hu, Linsen Xiong, Haibo Wang, and Zhimei Qi
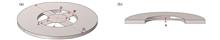
ObjectiveMini-unmanned aerial vehicle (Mini-UAV) is widely employed in scientific research and entertainment due to its small size, low cost, easy operation, and high flexibility. However, the“abuse”of mini-UAVs has caused great hidden dangers to public security and personal privacy. Therefore, radio, radar, image recognition, and other detection methods have been proposed to meet the urgent need for mini-UAV detection and surveillance. However, since mini-UAVs have low altitudes, low speeds, and a small reflective cross-sectional area, it is difficult for radars to detect them quickly under the interference of the complex background. Additionally, radio detection is prone to false alarms due to severe electromagnetic interference at low altitudes. Although CNN-based image recognition has a high detection accuracy, the ability to accurately distinguish between birds and mini-UAVs is affected by image resolution, which needs to be improved. Meanwhile, the above methods have complex equipment, high detection costs, and poor real-time performance. In contrast, the mini-UAV can be quickly detected in noisy low-altitude environments by acoustic detection, which features sound real-time performance, simple equipment, and low cost. However, the current acoustic sensors adopted for acoustic detection have low sensitivity and do not recognize the sound source direction. Therefore, we fabricate a fiber-optic acoustic sensor with a resonant MEMS wheel-shaped diaphragm to detect acoustic signals with high sensitivity and high signal-to-noise ratio (SNR) near the resonance peak. The sensor has an“8”shaped directional response, which allows for the identification of the sound source direction. Finally, a new method is provided for mini-UAV detection.MethodsTo improve the sensitivity of optical fiber acoustic sensors and reduce the damping effect caused by the enclosed back cavity of the circular diaphragm, we adopt a wheel-shaped diaphragm with an open acoustic back cavity as the acoustic sensing diaphragm. The wheel-shaped diaphragm consists of a central diaphragm connected to four symmetrically distributed connecting arms on an outer base ring. Firstly, the geometric structure of the wheel-shaped diaphragm is modeled by acoustic vibration theory. According to the characteristics of the mini-UAV's radiated noise spectrum, the diaphragm eigenfrequency is set near the mini-UAV noise fingerprint frequency, and the geometric parameters of the wheel-shaped diaphragm at this frequency are calculated. The acoustic characteristics are simulated and verified via finite element analysis software. Then, the wheel-shaped diaphragm is fabricated using MEMS processing technology. Meanwhile, to optimize the sensor performance, we sputter a metal on the diaphragm surface to improve the optical reflectivity of the diaphragm. Finally, the fiber optic acoustic sensor of the silicon-based MEMS wheel diaphragm is assembled by mechanical micro-assembly. In addition, the cavity length of its static Fabry-Pérot (FP) interference cavity is adjusted to make the sensor work at the quadrature point, which ensures high sensitivity without signal distortion.Results and DiscussionsA fiber optic acoustic sensor is fabricated using the designed silicon-based MEMS wheel-shaped diaphragm (Fig. 5). The FP static cavity length is measured using interferometric spectroscopy. The experiment shows that when the laser wavelength is 1550 nm, the FP static cavity length is 144.457 μm, which meets the quadrature point (Fig. 6). An acoustic testing system is built to characterize the performance of the wheel-shaped diaphragm fiber-optic acoustic sensor (Fig. 7). The sensor has a resonance peak at 7.279 kHz and a relatively flat response in the frequency range of 2-6 kHz below the resonant frequency (Fig. 8). At normal incidence of 7 kHz sound, the sound pressure sensitivity is 1.8 V/Pa, the SNR is 71 dB, and the minimum detectable sound pressure is 99 μPa/Hz0.5 (Fig. 9). In outdoor mini-UAV detection experiments, mini-UAV noise can be accurately detected within a range of 65 m, with a detection capability about three times that of commercial ECM (Fig. 13).ConclusionsTo detect the radiation noise of mini-UAVs, we design and fabricate a fiber-optic acoustic sensor with a silicon-based MEMS wheel-shaped diaphragm. The wheel-shaped diaphragm consists of a central vibrating membrane and four symmetrically distributed joint arms, and it has high sensitivity near the resonance frequency and the ability to detect mini-UAV at a distance. The sensor has a resonance peak at 7.279 kHz. At the normal incidence of 7 kHz sound, the sound pressure sensitivity is 1.8 V/Pa, the SNR is 71 dB, and the minimum detectable sound pressure is 99 μPa/Hz0.5. Additionally, it has an“8”shaped directional pattern, which indicates its ability to identify the sound source direction. It can accurately identify the noise of mini-UAVs within a range of 65 m, and the detection ability is about three times that of commercial ECM. This indicates its advantages and potential in applications such as mini-UAV detection in some special situations. ObjectiveMini-unmanned aerial vehicle (Mini-UAV) is widely employed in scientific research and entertainment due to its small size, low cost, easy operation, and high flexibility. However, the“abuse”of mini-UAVs has caused great hidden dangers to public security and personal privacy. Therefore, radio, radar, image recognition, and other detection methods have been proposed to meet the urgent need for mini-UAV detection and surveillance. However, since mini-UAVs have low altitudes, low speeds, and a small reflective cross-sectional area, it is difficult for radars to detect them quickly under the interference of the complex background. Additionally, radio detection is prone to false alarms due to severe electromagnetic interference at low altitudes. Although CNN-based image recognition has a high detection accuracy, the ability to accurately distinguish between birds and mini-UAVs is affected by image resolution, which needs to be improved. Meanwhile, the above methods have complex equipment, high detection costs, and poor real-time performance. In contrast, the mini-UAV can be quickly detected in noisy low-altitude environments by acoustic detection, which features sound real-time performance, simple equipment, and low cost. However, the current acoustic sensors adopted for acoustic detection have low sensitivity and do not recognize the sound source direction. Therefore, we fabricate a fiber-optic acoustic sensor with a resonant MEMS wheel-shaped diaphragm to detect acoustic signals with high sensitivity and high signal-to-noise ratio (SNR) near the resonance peak. The sensor has an“8”shaped directional response, which allows for the identification of the sound source direction. Finally, a new method is provided for mini-UAV detection.MethodsTo improve the sensitivity of optical fiber acoustic sensors and reduce the damping effect caused by the enclosed back cavity of the circular diaphragm, we adopt a wheel-shaped diaphragm with an open acoustic back cavity as the acoustic sensing diaphragm. The wheel-shaped diaphragm consists of a central diaphragm connected to four symmetrically distributed connecting arms on an outer base ring. Firstly, the geometric structure of the wheel-shaped diaphragm is modeled by acoustic vibration theory. According to the characteristics of the mini-UAV's radiated noise spectrum, the diaphragm eigenfrequency is set near the mini-UAV noise fingerprint frequency, and the geometric parameters of the wheel-shaped diaphragm at this frequency are calculated. The acoustic characteristics are simulated and verified via finite element analysis software. Then, the wheel-shaped diaphragm is fabricated using MEMS processing technology. Meanwhile, to optimize the sensor performance, we sputter a metal on the diaphragm surface to improve the optical reflectivity of the diaphragm. Finally, the fiber optic acoustic sensor of the silicon-based MEMS wheel diaphragm is assembled by mechanical micro-assembly. In addition, the cavity length of its static Fabry-Pérot (FP) interference cavity is adjusted to make the sensor work at the quadrature point, which ensures high sensitivity without signal distortion.Results and DiscussionsA fiber optic acoustic sensor is fabricated using the designed silicon-based MEMS wheel-shaped diaphragm (Fig. 5). The FP static cavity length is measured using interferometric spectroscopy. The experiment shows that when the laser wavelength is 1550 nm, the FP static cavity length is 144.457 μm, which meets the quadrature point (Fig. 6). An acoustic testing system is built to characterize the performance of the wheel-shaped diaphragm fiber-optic acoustic sensor (Fig. 7). The sensor has a resonance peak at 7.279 kHz and a relatively flat response in the frequency range of 2-6 kHz below the resonant frequency (Fig. 8). At normal incidence of 7 kHz sound, the sound pressure sensitivity is 1.8 V/Pa, the SNR is 71 dB, and the minimum detectable sound pressure is 99 μPa/Hz0.5 (Fig. 9). In outdoor mini-UAV detection experiments, mini-UAV noise can be accurately detected within a range of 65 m, with a detection capability about three times that of commercial ECM (Fig. 13).ConclusionsTo detect the radiation noise of mini-UAVs, we design and fabricate a fiber-optic acoustic sensor with a silicon-based MEMS wheel-shaped diaphragm. The wheel-shaped diaphragm consists of a central vibrating membrane and four symmetrically distributed joint arms, and it has high sensitivity near the resonance frequency and the ability to detect mini-UAV at a distance. The sensor has a resonance peak at 7.279 kHz. At the normal incidence of 7 kHz sound, the sound pressure sensitivity is 1.8 V/Pa, the SNR is 71 dB, and the minimum detectable sound pressure is 99 μPa/Hz0.5. Additionally, it has an“8”shaped directional pattern, which indicates its ability to identify the sound source direction. It can accurately identify the noise of mini-UAVs within a range of 65 m, and the detection ability is about three times that of commercial ECM. This indicates its advantages and potential in applications such as mini-UAV detection in some special situations.
Acta Optica Sinica
- Publication Date: Apr. 10, 2024
- Vol. 44, Issue 7, 0728002 (2024)
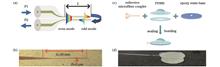
Dual-Channel Reflective Optical Microfiber Coupler Diaphragms for Continuous and Accurate Blood Pressure Monitoring
Xue Zou, Junhao Fan, Binbin Luo, Fumin Zhou, Decao Wu, Zufan Zhang, and Mingfu Zhao
ObjectiveCardiovascular disease (CVD) is the most important cause of human death, of which hypertension is the most common chronic disease in people's life and is one of the most important risk factors for CVD. With the socio-economic development and accelerating population aging and urbanization, hypertension is on the rise. According to research, the presymptoms of hypertension are not obvious, and a considerable portion of patients do not have any uncomfortable clinical symptom such as dizziness, headache, and shortness of breath. When blood pressure is elevated for a long time and exceeds the normal range, this may result in serious complications and even threaten life safety. Therefore, accurate blood pressure monitoring is crucial for early diagnosis and intervention treatment. However, compared with the single point in time blood pressure detection of traditional cuff-type electronic blood pressure monitors, continuous dynamic monitoring can more truly reflect the real-time changes in blood pressure and dynamic trends, providing more comprehensive and accurate data. The human pulse signal contains a large amount of physiological and pathological information related to the cardiovascular system, and continuous blood pressure monitoring can be realized by accurately extracting the characteristic parameters and building a blood pressure prediction model. Currently, the main method of pulse signal detection is the PPG method, whose major drawbacks are high power consumption, sensitivity to ambient light and pressure perturbation, and susceptibility of electronic components to electromagnetic wave interference. As a result, it is impossible to measure blood pressure simultaneously in special environments such as MRI and CT. Thus, we propose a fiber-optic blood pressure sensor with continuous accurate measurement and without spatial alignment based on the microstructural setup of a reflective microfiber coupler, which is achieved by combining dual-channel pulse wave acquisition and machine-learning model prediction. This electromagnetic interference-resistant, wearable, and continuous blood pressure monitoring system will play an important role in human CVD prevention in the future.MethodsFirst, two single-mode fibers twisted around each other are drawn into a microfiber coupler using the flame fusion taper method, and the reflective coupler is formed by cutting flat at the section of the waist region area, which has a diameter of 5 μm and a length of 10 mm. The device is encapsulated between an epoxy resin substrate and two layers of PDMS circular films, where the substrate is a through-hole structure, the upper PDMS layer is a circular film with a diameter of 15 mm and a thickness of 100 μm, and the lower PDMS is a raised spherical structure with a diameter of 10 mm and a height of 1.5 mm. Particularly, this structure can improve the detection sensitivity and reduce the sensitivity of the sensing area to the spatial location. Then, a dual-channel pulse wave detection system is set up to obtain the brachial artery transit time (BPTT), the radial artery transit time (RPTT), and the transit time difference between the radial artery and brachial artery (DBRPTT). Finally, the support vector regression algorithm is utilized to build a blood pressure prediction model to realize continuous and accurate blood pressure detection.Results and DiscussionsThe mechanical simulation results of the packaging structure show that it can sense micro-pressure from multiple directions, reducing its dependence on the detection position (Figs. 2-3). In the static pressure experiment, the detection sensitivity is -0.682 kPa-1 in the range of 500-1000 Pa. The sensor can respond immediately at the moment of loading and unloading pressure, with the response time of 35 ms and 46 ms respectively. Additionally, the durability and repeatability of the sensor are also tested. After 2500 cycles of the periodic pressure with a frequency of 5 Hz and a size of 1 N, the sensor still shows good response and excellent repeatability. After about 5000 cycles, the response amplitude drops by about 5% from the beginning. Since the time for sensing to measure pulse is short (about five seconds), less impact is exerted on later blood pressure prediction. When the sensor is placed at different positions in the radial artery area, the sensor can effectively detect high-fidelity pulse signals, indicating that there are no strict alignment requirements between the sensor and the artery (Fig. 5). By employing a dual-channel sensing system, the pulse waveforms at the radial artery and brachial artery are collected simultaneously. Three PTT (BPTT, RPTT, and DBRPTT) characteristic parameters (Fig. 6) are extracted from these sample data to build a blood pressure prediction model. The correlation diagram and Bland-Altman diagram reveal that both the true and the predicted values are negatively correlated with the K value. The correlation coefficient R values of SBP and DBP are 0.96 and 0.95 respectively, which indicates that there is a good positive correlation between the reference and predicted values. The mean difference value and SD value of SBP are 0.08 mmHg and 1.13 mmHg respectively, and the mean difference value and SD value of DBP are -0.35 mmHg and 1.25 mmHg respectively (Fig. 11). These indicators are both lower than the AAMI standard [(5±8) mmHg]. The performance comparison results between the sensor and other blood pressure sensors show that the sensor features an extremely compact structure, high sensitivity, sound stability, long service life, and anti-electromagnetic interference. Finally, a volunteer is randomly selected to collect 14 sets of data from 8:00 to 21:00 a day to verify the feasibility of the sensor. The results demonstrate that the normal pattern of“two peaks and one trough”is blood pressure trends. Another volunteer receives continuous monitoring during a mixed exercise of squatting and jogging. As the exercise time increases, both SBP and DBP rise but remain stable after about ten minutes (Fig. 12). This shows that the proposed blood pressure monitoring system can continuously and effectively monitor the health level of blood pressure.ConclusionsWe develop a reflective optical microfiber coupler sensor chip (R-OMCSC) for cardiovascular health assessment of accurate and continuous blood pressure monitoring. The R-OMCSC exhibits performance with high sensitivity and detection pulse wave without spatial alignment, which allows for perceiving weak physiological signals. Embedding the sensor into a sports wristband, we construct a dual-channel pulse wave detection system, obtain the RPTT, DPTT, and DBRPTT values, and build an SVR prediction model. Experimental results show that the system can achieve continuous blood pressure monitoring. In the future, we will keep improving the integration of the photoelectric signal processing system with the proposed dual-channel R-OMCSC pulse wave sensor, and a large amount of data will be collected for more accurate analysis. The proposed non-invasive BP detection system features high accuracy and continuous monitoring and will have the opportunity to be employed for clinical applications and thus help patients with CVD prevention. ObjectiveCardiovascular disease (CVD) is the most important cause of human death, of which hypertension is the most common chronic disease in people's life and is one of the most important risk factors for CVD. With the socio-economic development and accelerating population aging and urbanization, hypertension is on the rise. According to research, the presymptoms of hypertension are not obvious, and a considerable portion of patients do not have any uncomfortable clinical symptom such as dizziness, headache, and shortness of breath. When blood pressure is elevated for a long time and exceeds the normal range, this may result in serious complications and even threaten life safety. Therefore, accurate blood pressure monitoring is crucial for early diagnosis and intervention treatment. However, compared with the single point in time blood pressure detection of traditional cuff-type electronic blood pressure monitors, continuous dynamic monitoring can more truly reflect the real-time changes in blood pressure and dynamic trends, providing more comprehensive and accurate data. The human pulse signal contains a large amount of physiological and pathological information related to the cardiovascular system, and continuous blood pressure monitoring can be realized by accurately extracting the characteristic parameters and building a blood pressure prediction model. Currently, the main method of pulse signal detection is the PPG method, whose major drawbacks are high power consumption, sensitivity to ambient light and pressure perturbation, and susceptibility of electronic components to electromagnetic wave interference. As a result, it is impossible to measure blood pressure simultaneously in special environments such as MRI and CT. Thus, we propose a fiber-optic blood pressure sensor with continuous accurate measurement and without spatial alignment based on the microstructural setup of a reflective microfiber coupler, which is achieved by combining dual-channel pulse wave acquisition and machine-learning model prediction. This electromagnetic interference-resistant, wearable, and continuous blood pressure monitoring system will play an important role in human CVD prevention in the future.MethodsFirst, two single-mode fibers twisted around each other are drawn into a microfiber coupler using the flame fusion taper method, and the reflective coupler is formed by cutting flat at the section of the waist region area, which has a diameter of 5 μm and a length of 10 mm. The device is encapsulated between an epoxy resin substrate and two layers of PDMS circular films, where the substrate is a through-hole structure, the upper PDMS layer is a circular film with a diameter of 15 mm and a thickness of 100 μm, and the lower PDMS is a raised spherical structure with a diameter of 10 mm and a height of 1.5 mm. Particularly, this structure can improve the detection sensitivity and reduce the sensitivity of the sensing area to the spatial location. Then, a dual-channel pulse wave detection system is set up to obtain the brachial artery transit time (BPTT), the radial artery transit time (RPTT), and the transit time difference between the radial artery and brachial artery (DBRPTT). Finally, the support vector regression algorithm is utilized to build a blood pressure prediction model to realize continuous and accurate blood pressure detection.Results and DiscussionsThe mechanical simulation results of the packaging structure show that it can sense micro-pressure from multiple directions, reducing its dependence on the detection position (Figs. 2-3). In the static pressure experiment, the detection sensitivity is -0.682 kPa-1 in the range of 500-1000 Pa. The sensor can respond immediately at the moment of loading and unloading pressure, with the response time of 35 ms and 46 ms respectively. Additionally, the durability and repeatability of the sensor are also tested. After 2500 cycles of the periodic pressure with a frequency of 5 Hz and a size of 1 N, the sensor still shows good response and excellent repeatability. After about 5000 cycles, the response amplitude drops by about 5% from the beginning. Since the time for sensing to measure pulse is short (about five seconds), less impact is exerted on later blood pressure prediction. When the sensor is placed at different positions in the radial artery area, the sensor can effectively detect high-fidelity pulse signals, indicating that there are no strict alignment requirements between the sensor and the artery (Fig. 5). By employing a dual-channel sensing system, the pulse waveforms at the radial artery and brachial artery are collected simultaneously. Three PTT (BPTT, RPTT, and DBRPTT) characteristic parameters (Fig. 6) are extracted from these sample data to build a blood pressure prediction model. The correlation diagram and Bland-Altman diagram reveal that both the true and the predicted values are negatively correlated with the K value. The correlation coefficient R values of SBP and DBP are 0.96 and 0.95 respectively, which indicates that there is a good positive correlation between the reference and predicted values. The mean difference value and SD value of SBP are 0.08 mmHg and 1.13 mmHg respectively, and the mean difference value and SD value of DBP are -0.35 mmHg and 1.25 mmHg respectively (Fig. 11). These indicators are both lower than the AAMI standard [(5±8) mmHg]. The performance comparison results between the sensor and other blood pressure sensors show that the sensor features an extremely compact structure, high sensitivity, sound stability, long service life, and anti-electromagnetic interference. Finally, a volunteer is randomly selected to collect 14 sets of data from 8:00 to 21:00 a day to verify the feasibility of the sensor. The results demonstrate that the normal pattern of“two peaks and one trough”is blood pressure trends. Another volunteer receives continuous monitoring during a mixed exercise of squatting and jogging. As the exercise time increases, both SBP and DBP rise but remain stable after about ten minutes (Fig. 12). This shows that the proposed blood pressure monitoring system can continuously and effectively monitor the health level of blood pressure.ConclusionsWe develop a reflective optical microfiber coupler sensor chip (R-OMCSC) for cardiovascular health assessment of accurate and continuous blood pressure monitoring. The R-OMCSC exhibits performance with high sensitivity and detection pulse wave without spatial alignment, which allows for perceiving weak physiological signals. Embedding the sensor into a sports wristband, we construct a dual-channel pulse wave detection system, obtain the RPTT, DPTT, and DBRPTT values, and build an SVR prediction model. Experimental results show that the system can achieve continuous blood pressure monitoring. In the future, we will keep improving the integration of the photoelectric signal processing system with the proposed dual-channel R-OMCSC pulse wave sensor, and a large amount of data will be collected for more accurate analysis. The proposed non-invasive BP detection system features high accuracy and continuous monitoring and will have the opportunity to be employed for clinical applications and thus help patients with CVD prevention.
Acta Optica Sinica
- Publication Date: Apr. 10, 2024
- Vol. 44, Issue 7, 0728001 (2024)

Phase Congruency Satellite Image Matching Method Based on Anisotropic Filtering
Qing Fu, Chen Guo, Wenlang Luo, and Shikun Xie
ObjectiveThe quality of satellite image matching directly affects the accuracy and reliability of the subsequent block adjustment accuracy, which in turn affects the generation of products such as digital orthophoto maps (DOMs) and digital elevation models (DEMs). The traditional scale-invariant feature transform (SIFT) algorithm based on image gradient features performs poorly in handling nonlinear radiation differences, and existing phase congruency matching methods have difficulty in simultaneously handling nonlinear radiation differences and geometric differences. For example, the radiation-variation insensitive feature transform (RIFT) algorithm has difficulty in handling large scale differences; the histogram of absolute phase consistency gradient (HAPCG) algorithm has a general matching effect for large rotation problems, and the histogram of orientated phase congruency (HOPC) algorithm requires more accurate geographic reference information. There are three challenges for satellite image matching with multiple phases, multiple views, and radiation differences. Traditional Gaussian linear scale space construction methods lead to image edge blur and loss of detail in the process of building image pyramids; traditional phase congruency methods have difficulty in extracting repeatable and robust feature points, and traditional random sample consensus (RANSAC) algorithm often fails to address the high rate of gross errors in the image matching process. We proposed a phase congruency satellite image matching method based on anisotropic filtering, which could further improve the accuracy and number of correctly matched points in satellite images with significant nonlinear radiation differences and geometric differences.MethodsIn light of the challenges posed by satellite matching images with varying phases, views, and radiation differences, we proposed a satellite image matching method based on anisotropic filtering and phase congruency. Firstly, anisotropic filtering was used to establish the nonlinear scale space of the image, and then the phase congruency model was used to calculate the maximum moment map at each scale. Secondly, feature points were extracted using the block-based Shi-Tomasi algorithm on the maximum moment map at each scale, and then the Log-Gabor filter was used to establish the amplitude response at multiple scales and orientations and calculate the maximum amplitude response and its corresponding orientation index. Then, in polar coordinates, feature descriptor construction was accelerated based on OpenMP parallel computing, followed by image matching and mismatch elimination. The proposed method further enhances the matching effect of satellite images with significant nonlinear radiation and geometric differences.Results and DiscussionsDue to significant nonlinear radiation and scale differences between satellite images taken at different time, the matching performance of the SIFT algorithm is poor, and the experimental data in group F does not yield correctly matched point (NCM) pairs. Similarly, the matching performance of the RIFT algorithm is mediocre, as the significant scale differences in the satellite images taken at different times result in fewer point pairs being matched. The matching performance of HAPCG algorithm is better than that of the RIFT algorithm, as it also utilizes a nonlinear scale space construction method, providing a certain level of robustness to scale differences. However, the method proposed in this paper achieves the best matching performance, being able to match a sufficient number of point pairs in agricultural, urban, and mountainous areas. Particularly, for satellite images taken at different time (groups D-F), as shown in Figs. 16-18, the proposed method outperforms the HAPCG algorithm, even when there are certain angular rotation differences between the images. Furthermore, the matching performance of these four matching methods on the six experimental datasets is quantitatively analyzed, including the statistical data for the NCMs and the root mean square error (RMSE), as shown in Table 1.ConclusionsIn response to the poor matching effects of satellite images with multiple phases, multiple views, and radiation differences, we propose a phase congruency image matching method based on anisotropic filtering. By utilizing anisotropic filtering to establish a nonlinear scale space for images, we propose an improved feature descriptor construction method for the phase congruency model and implement feature descriptor acceleration construction based on OpenMP parallel computing. The proposed method has demonstrated significant advantages in terms of NCMs compared with existing matching algorithms, particularly excelling in handling weak texture, repetitive texture, non-coincident time phases, and nonlinear radiation differences. In the future, we will explore how to integrate cutting-edge technologies such as deep learning to further enhance the robustness and applicability of the matching method. ObjectiveThe quality of satellite image matching directly affects the accuracy and reliability of the subsequent block adjustment accuracy, which in turn affects the generation of products such as digital orthophoto maps (DOMs) and digital elevation models (DEMs). The traditional scale-invariant feature transform (SIFT) algorithm based on image gradient features performs poorly in handling nonlinear radiation differences, and existing phase congruency matching methods have difficulty in simultaneously handling nonlinear radiation differences and geometric differences. For example, the radiation-variation insensitive feature transform (RIFT) algorithm has difficulty in handling large scale differences; the histogram of absolute phase consistency gradient (HAPCG) algorithm has a general matching effect for large rotation problems, and the histogram of orientated phase congruency (HOPC) algorithm requires more accurate geographic reference information. There are three challenges for satellite image matching with multiple phases, multiple views, and radiation differences. Traditional Gaussian linear scale space construction methods lead to image edge blur and loss of detail in the process of building image pyramids; traditional phase congruency methods have difficulty in extracting repeatable and robust feature points, and traditional random sample consensus (RANSAC) algorithm often fails to address the high rate of gross errors in the image matching process. We proposed a phase congruency satellite image matching method based on anisotropic filtering, which could further improve the accuracy and number of correctly matched points in satellite images with significant nonlinear radiation differences and geometric differences.MethodsIn light of the challenges posed by satellite matching images with varying phases, views, and radiation differences, we proposed a satellite image matching method based on anisotropic filtering and phase congruency. Firstly, anisotropic filtering was used to establish the nonlinear scale space of the image, and then the phase congruency model was used to calculate the maximum moment map at each scale. Secondly, feature points were extracted using the block-based Shi-Tomasi algorithm on the maximum moment map at each scale, and then the Log-Gabor filter was used to establish the amplitude response at multiple scales and orientations and calculate the maximum amplitude response and its corresponding orientation index. Then, in polar coordinates, feature descriptor construction was accelerated based on OpenMP parallel computing, followed by image matching and mismatch elimination. The proposed method further enhances the matching effect of satellite images with significant nonlinear radiation and geometric differences.Results and DiscussionsDue to significant nonlinear radiation and scale differences between satellite images taken at different time, the matching performance of the SIFT algorithm is poor, and the experimental data in group F does not yield correctly matched point (NCM) pairs. Similarly, the matching performance of the RIFT algorithm is mediocre, as the significant scale differences in the satellite images taken at different times result in fewer point pairs being matched. The matching performance of HAPCG algorithm is better than that of the RIFT algorithm, as it also utilizes a nonlinear scale space construction method, providing a certain level of robustness to scale differences. However, the method proposed in this paper achieves the best matching performance, being able to match a sufficient number of point pairs in agricultural, urban, and mountainous areas. Particularly, for satellite images taken at different time (groups D-F), as shown in Figs. 16-18, the proposed method outperforms the HAPCG algorithm, even when there are certain angular rotation differences between the images. Furthermore, the matching performance of these four matching methods on the six experimental datasets is quantitatively analyzed, including the statistical data for the NCMs and the root mean square error (RMSE), as shown in Table 1.ConclusionsIn response to the poor matching effects of satellite images with multiple phases, multiple views, and radiation differences, we propose a phase congruency image matching method based on anisotropic filtering. By utilizing anisotropic filtering to establish a nonlinear scale space for images, we propose an improved feature descriptor construction method for the phase congruency model and implement feature descriptor acceleration construction based on OpenMP parallel computing. The proposed method has demonstrated significant advantages in terms of NCMs compared with existing matching algorithms, particularly excelling in handling weak texture, repetitive texture, non-coincident time phases, and nonlinear radiation differences. In the future, we will explore how to integrate cutting-edge technologies such as deep learning to further enhance the robustness and applicability of the matching method.
Acta Optica Sinica
- Publication Date: Mar. 25, 2024
- Vol. 44, Issue 6, 0628007 (2024)
Multi-Scale Optical Remote Sensing Image Target Detection Based On Enhanced Small Target Features
Huilin Shan, Shuoyang Wang, Junyi Tong, Yuxiang Hu, Yanhao Zhang, and Yinsheng Zhang
ObjectiveRemote sensing technology is a method to observe and obtain information about objects and phenomena on the Earth's surface by satellites and aircraft. It allows us to obtain large-scale, multi-spectral, and high-resolution data from remote locations on Earth. The global and real-time technology features multi-spectral observation, high resolution, and multi-source data fusion without contact. Remote sensing target detection is a process of target recognition and extraction using remote sensing data. It aims to automatically detect, locate, and identify specific target types from remote sensing images, which is of significance for disaster warning and response, environmental monitoring, and ecological protection.MethodsThe traditional remote sensing image target detection algorithms include valley threshold and Sobel operator and convolutional neural network (CNN) algorithm, of which the most widely employed is the CNN. The algorithm has sound feature extraction and pattern recognition capabilities, but it is sensitive to locations and scale and may still perform poorly when small targets or large-scale changes are involved. Therefore, for the detection of remote sensing targets, it is necessary to consider many factors such as complex background, unbalanced target distribution, dense target, false detection, and missed detection. Therefore, we propose a multi-scale neural network for enhancing small target features (ESF-MNet) to deal with the low detection accuracy and poor generalization of current remote sensing targets. The core idea is to combine multiple CBH modules and CA attention mechanism to form a multi-residual cascade layer and perform efficient aggregation to enhance target feature expression. The RFE module is introduced to help the network better respond to remote sensing targets of different scales. GSConv and CARAFE modules are utilized to form the main structure of the Neck end. While reducing the amount of parameters and maintaining accuracy, the CARAFE module is adopted to improve the semantic extraction ability of the network. Meanwhile, a detection head that is more suitable for small targets is constructed to reduce the lost small target information as the network depth increases.Results and DiscussionsQualitative and quantitative experiments are carried out on mainstream remote sensing detection models such as ESF-MNet, with ablation experiments analyzed. To verify the effectiveness of each improvement point, we conduct seven experiments on DOTA and NWPU NHR-10 datasets under the same environment and parameters based on the YOLOv7 network model. The detected image targets have complex backgrounds, as shown in Table 1. If the attention effect is not employed alone, the mentioned EACM module can significantly improve the effect. The proposed receptive field enhancement module effectively captures context information at different scales. The constructed Neck layer simplifies the network structure and improves the semantic extraction ability, and the proposed detection layer is suitable for small targets and enhances the fusion of shallow features. The mAP0.5 is improved by 3.7% and 4.5% on the two datasets respectively, which proves the effectiveness of each module. The proposed algorithm is compared with other algorithms to further compare the model performance. The experimental environment is the same, with the same training set and test set adopted. Faster R-CNN, FMSSD, YOLOv5s, YOLOv7, YOLOv8s, algorithms in Refs. [21-23], and the proposed algorithm are shown in Tables 2 and 3. In terms of average accuracy value, the ESF-MNet model performs best. Especially in the aspect of custom small targets, the performance is more prominent. The mAP reaches 83.6% and 97.6% respectively. However, the algorithm accuracy does not reach the best level when detecting some large target objects (such as track and field, basketball court). The main reason is that the network depth after model lightweight is shallow and the downsampling multiple is small. If the network depth and the downsampling multiple increase, although the detection effect of large targets can be improved, poor detection of small targets will be caused. Therefore, our research focus is to improve the detection accuracy of small and medium-sized targets on the premise of ensuring higher detection accuracy for large targets. Generally, compared with other algorithms, the proposed algorithm still has obvious advantages in mAP, greatly reduces the false detection rate, and also meets the basic needs of real-time detection.ConclusionsThe detection and recognition of targets in optical remote sensing images is of significance for civilian applications. However, in the case of complex background, dense small targets, and lack of feature information, the identification of small targets is very difficult. Meanwhile, we construct an efficient layer attention aggregation module in the backbone network to extract the target features of various categories and employ the receptive field enhancement module to fuse the feature maps of different depths and thus improve the information expression ability of the network. Additionally, by utilizing GSConv and CARAFE modules to form the Neck layer, and adopting the compression method of halving the number of channels, the neck is finely processed, and the cross-stage partial network (GSCSP) module VoV-GSCSP module is designed by one-time aggregation method, which can reduce the network computation and improve the detection speed. With the addition of the CARAFE module, the detection accuracy is improved. In addition, a multi-scale network is constructed by leveraging a feature output layer with a lower sampling rate of 4, 8, and 16 times in the detection head structure, which effectively improves the detection of small targets. Experimental results show that the model has sound real-time performance and strong robustness for small target detection in complex background. Although the model has been improved, it may still has missed detection and error detection. Although the remote sensing image target detection method is mature, it is still difficult to calculate the large and complex, accurate, and efficient method. However, we will continue to study and solve these problems in the future. ObjectiveRemote sensing technology is a method to observe and obtain information about objects and phenomena on the Earth's surface by satellites and aircraft. It allows us to obtain large-scale, multi-spectral, and high-resolution data from remote locations on Earth. The global and real-time technology features multi-spectral observation, high resolution, and multi-source data fusion without contact. Remote sensing target detection is a process of target recognition and extraction using remote sensing data. It aims to automatically detect, locate, and identify specific target types from remote sensing images, which is of significance for disaster warning and response, environmental monitoring, and ecological protection.MethodsThe traditional remote sensing image target detection algorithms include valley threshold and Sobel operator and convolutional neural network (CNN) algorithm, of which the most widely employed is the CNN. The algorithm has sound feature extraction and pattern recognition capabilities, but it is sensitive to locations and scale and may still perform poorly when small targets or large-scale changes are involved. Therefore, for the detection of remote sensing targets, it is necessary to consider many factors such as complex background, unbalanced target distribution, dense target, false detection, and missed detection. Therefore, we propose a multi-scale neural network for enhancing small target features (ESF-MNet) to deal with the low detection accuracy and poor generalization of current remote sensing targets. The core idea is to combine multiple CBH modules and CA attention mechanism to form a multi-residual cascade layer and perform efficient aggregation to enhance target feature expression. The RFE module is introduced to help the network better respond to remote sensing targets of different scales. GSConv and CARAFE modules are utilized to form the main structure of the Neck end. While reducing the amount of parameters and maintaining accuracy, the CARAFE module is adopted to improve the semantic extraction ability of the network. Meanwhile, a detection head that is more suitable for small targets is constructed to reduce the lost small target information as the network depth increases.Results and DiscussionsQualitative and quantitative experiments are carried out on mainstream remote sensing detection models such as ESF-MNet, with ablation experiments analyzed. To verify the effectiveness of each improvement point, we conduct seven experiments on DOTA and NWPU NHR-10 datasets under the same environment and parameters based on the YOLOv7 network model. The detected image targets have complex backgrounds, as shown in Table 1. If the attention effect is not employed alone, the mentioned EACM module can significantly improve the effect. The proposed receptive field enhancement module effectively captures context information at different scales. The constructed Neck layer simplifies the network structure and improves the semantic extraction ability, and the proposed detection layer is suitable for small targets and enhances the fusion of shallow features. The mAP0.5 is improved by 3.7% and 4.5% on the two datasets respectively, which proves the effectiveness of each module. The proposed algorithm is compared with other algorithms to further compare the model performance. The experimental environment is the same, with the same training set and test set adopted. Faster R-CNN, FMSSD, YOLOv5s, YOLOv7, YOLOv8s, algorithms in Refs. [21-23], and the proposed algorithm are shown in Tables 2 and 3. In terms of average accuracy value, the ESF-MNet model performs best. Especially in the aspect of custom small targets, the performance is more prominent. The mAP reaches 83.6% and 97.6% respectively. However, the algorithm accuracy does not reach the best level when detecting some large target objects (such as track and field, basketball court). The main reason is that the network depth after model lightweight is shallow and the downsampling multiple is small. If the network depth and the downsampling multiple increase, although the detection effect of large targets can be improved, poor detection of small targets will be caused. Therefore, our research focus is to improve the detection accuracy of small and medium-sized targets on the premise of ensuring higher detection accuracy for large targets. Generally, compared with other algorithms, the proposed algorithm still has obvious advantages in mAP, greatly reduces the false detection rate, and also meets the basic needs of real-time detection.ConclusionsThe detection and recognition of targets in optical remote sensing images is of significance for civilian applications. However, in the case of complex background, dense small targets, and lack of feature information, the identification of small targets is very difficult. Meanwhile, we construct an efficient layer attention aggregation module in the backbone network to extract the target features of various categories and employ the receptive field enhancement module to fuse the feature maps of different depths and thus improve the information expression ability of the network. Additionally, by utilizing GSConv and CARAFE modules to form the Neck layer, and adopting the compression method of halving the number of channels, the neck is finely processed, and the cross-stage partial network (GSCSP) module VoV-GSCSP module is designed by one-time aggregation method, which can reduce the network computation and improve the detection speed. With the addition of the CARAFE module, the detection accuracy is improved. In addition, a multi-scale network is constructed by leveraging a feature output layer with a lower sampling rate of 4, 8, and 16 times in the detection head structure, which effectively improves the detection of small targets. Experimental results show that the model has sound real-time performance and strong robustness for small target detection in complex background. Although the model has been improved, it may still has missed detection and error detection. Although the remote sensing image target detection method is mature, it is still difficult to calculate the large and complex, accurate, and efficient method. However, we will continue to study and solve these problems in the future.
Acta Optica Sinica
- Publication Date: Mar. 10, 2024
- Vol. 44, Issue 6, 0628006 (2024)
Laser Spot Centroid Extraction Method and Stability Analysis of "Gou Mang"
Ke Wan, Jingmei Li, Qijin Han, Gongwei Li, Ning Wang, Zhaopeng Xu, Hang Zhao, and Lingling Ma
ObjectiveThe first Terrestrial Ecosystem Carbon Monitoring (TECM-1) satellite—Gou Mang was successfully launched on August 4, 2022 in China. TECM-1 satellite is equipped with a multi-beam LiDAR which is mainly used to obtain the elevation of land and forest. The mission of measuring the elevation of a forest requires both high-ranging accuracy and horizontal positioning accuracy. The multi-beams LiDAR on the TECM-1 satellite is concurrently equipped with an optical axis monitoring camera to obtain the footprint images, including the ground images and spot images. The centroid of the laser spot in the spot image can indicate the laser pointing angle, helping reduce the horizontal positioning errors. However, the laser spot is inevitably influenced by the background features in the spot image, and traditional centroid extraction methods are difficult to achieve ideal accuracy. Many scholars have made improvements based on traditional methods, and most of them apply noise reduction processing to the spot image, such as grayscale threshold constraint and image filtering. However, due to the influence of photography conditions and complex terrain, it is challenging for these relatively simple noise reduction methods to separate the laser spot from background noise. The centroid extraction accuracy still faces challenges in complex background scenarios. We report a laser spot centroid extraction method against complex background noise, which can effectively remove background noise from the spot image. It achieves better adaptability and higher accuracy than previous methods. We hope that our research can provide a certain reference value for the future processing and application of laser data collected by the TECM-1 satellite.MethodsA set of footprint images collected by the TECM-1 satellite consists of the ground image and spot image and the spot image can be considered to be formed by the laser spot and surrounding background features. The ground image and spot image are geometrically aligned and exhibit noticeable brightness differences due to varying exposure time (Fig. 2). Based on the characteristics of footprint images, the present study firstly crops spot area image pairs and non-spot area image pairs from footprint images. Then, the grayscale transformation coefficients are calculated by non-spot area image pairs, and the background grayscale values can be removed from the spot image. Subsequently, a distance constraint is adopted to limit the range of laser spots and a Gaussian filter is applied to smooth the spot image. Then an adaptive threshold is estimated by Otsu's method for binary segmentation. It generates a binary mask of the laser spot and with the mask processing, the noise of the spot image can be almost eliminated. Finally, the centroid coordinates of the laser spot are calculated by the grayscale centroid method. The proposed method is tested with simulated and actual spot images, and the accuracy of centroid extraction is analyzed along with the stability of the laser spot centroids.Results and DiscussionsFor the generated 10215 simulated laser spots, our method exhibits significantly improved centroid extraction accuracy compared to the Gaussian fitting method, grayscale centroid method, and ellipse fitting method. It results in an average error of approximately 0.059 pixel, and a root mean square error of about 0.074 pixel, slightly higher than those of Ren's method. The maximum error is 0.482 pixel, better than Ren's 1.828 pixel (Table 2). Furthermore, the CE90 of the proposed method is approximately 0.11 pixel (Fig. 6). In addition, our method is approximately 60% faster than Ren's method and comparable to the ellipse fitting method in processing time (Table 3). When applied to 1000 sets of consecutive footprint images obtained within 25 s, our method suggests that the standard deviation of centroid coordinates is less than 0.05 pixel. The range is within 0.2 pixel in a single direction (Table 5), demonstrating strong stability (Fig. 7 and Fig. 8). We select over 40 scenes of footprint images at intervals of 5 d to analyze the stability of centroids, and the results show that the standard deviations of centroid coordinates distribute between 0.12 and 0.34 pixel. It corresponds to horizontal distances of about 1 to 2.7 m on the ground, signifying that the relative geometric relationship between the laser and optical axis monitoring camera is relatively stable (Table 6). Additionally, the stability of centroid coordinates varies from different laser beams in the monitoring range (Figs. 9-13). It can be found that regular monitoring for the stability of centroids is necessary to comprehend centroid variations.ConclusionsWe report a laser spot centroid extraction method against complex background noise based on the footprint images collected by the TECM-1 satellite. Our method uses grayscale matching to remove most of the background noise from the spot image, followed by distance constraint, Gaussian filtering, and Otsu's image segmentation to remove the residual noise. The method ultimately calculates the centroid coordinates of the laser spot by the grayscale centroid method. Assessed by simulated and actual spot images of various terrain types, the results demonstrate that our method exhibits robust adaptability to laser spots in complex background scenarios and displays strong stability. However, for ground images with a significant number of saturated grayscale values, the present grayscale matching method cannot remove the background noise completely and it will affect the final centroid extraction accuracy. Future research should explore optimizing the grayscale transformation model or introducing other constraints to address this issue. The results of the stability analysis reveal a relatively tight jitter scope of centroids during the monitoring range, indicating a relatively stable geometric relationship between the laser and optical axis monitoring camera. Our study will be employed to support laser positioning, with the goal of enhancing the horizontal positioning precision of laser data. ObjectiveThe first Terrestrial Ecosystem Carbon Monitoring (TECM-1) satellite—Gou Mang was successfully launched on August 4, 2022 in China. TECM-1 satellite is equipped with a multi-beam LiDAR which is mainly used to obtain the elevation of land and forest. The mission of measuring the elevation of a forest requires both high-ranging accuracy and horizontal positioning accuracy. The multi-beams LiDAR on the TECM-1 satellite is concurrently equipped with an optical axis monitoring camera to obtain the footprint images, including the ground images and spot images. The centroid of the laser spot in the spot image can indicate the laser pointing angle, helping reduce the horizontal positioning errors. However, the laser spot is inevitably influenced by the background features in the spot image, and traditional centroid extraction methods are difficult to achieve ideal accuracy. Many scholars have made improvements based on traditional methods, and most of them apply noise reduction processing to the spot image, such as grayscale threshold constraint and image filtering. However, due to the influence of photography conditions and complex terrain, it is challenging for these relatively simple noise reduction methods to separate the laser spot from background noise. The centroid extraction accuracy still faces challenges in complex background scenarios. We report a laser spot centroid extraction method against complex background noise, which can effectively remove background noise from the spot image. It achieves better adaptability and higher accuracy than previous methods. We hope that our research can provide a certain reference value for the future processing and application of laser data collected by the TECM-1 satellite.MethodsA set of footprint images collected by the TECM-1 satellite consists of the ground image and spot image and the spot image can be considered to be formed by the laser spot and surrounding background features. The ground image and spot image are geometrically aligned and exhibit noticeable brightness differences due to varying exposure time (Fig. 2). Based on the characteristics of footprint images, the present study firstly crops spot area image pairs and non-spot area image pairs from footprint images. Then, the grayscale transformation coefficients are calculated by non-spot area image pairs, and the background grayscale values can be removed from the spot image. Subsequently, a distance constraint is adopted to limit the range of laser spots and a Gaussian filter is applied to smooth the spot image. Then an adaptive threshold is estimated by Otsu's method for binary segmentation. It generates a binary mask of the laser spot and with the mask processing, the noise of the spot image can be almost eliminated. Finally, the centroid coordinates of the laser spot are calculated by the grayscale centroid method. The proposed method is tested with simulated and actual spot images, and the accuracy of centroid extraction is analyzed along with the stability of the laser spot centroids.Results and DiscussionsFor the generated 10215 simulated laser spots, our method exhibits significantly improved centroid extraction accuracy compared to the Gaussian fitting method, grayscale centroid method, and ellipse fitting method. It results in an average error of approximately 0.059 pixel, and a root mean square error of about 0.074 pixel, slightly higher than those of Ren's method. The maximum error is 0.482 pixel, better than Ren's 1.828 pixel (Table 2). Furthermore, the CE90 of the proposed method is approximately 0.11 pixel (Fig. 6). In addition, our method is approximately 60% faster than Ren's method and comparable to the ellipse fitting method in processing time (Table 3). When applied to 1000 sets of consecutive footprint images obtained within 25 s, our method suggests that the standard deviation of centroid coordinates is less than 0.05 pixel. The range is within 0.2 pixel in a single direction (Table 5), demonstrating strong stability (Fig. 7 and Fig. 8). We select over 40 scenes of footprint images at intervals of 5 d to analyze the stability of centroids, and the results show that the standard deviations of centroid coordinates distribute between 0.12 and 0.34 pixel. It corresponds to horizontal distances of about 1 to 2.7 m on the ground, signifying that the relative geometric relationship between the laser and optical axis monitoring camera is relatively stable (Table 6). Additionally, the stability of centroid coordinates varies from different laser beams in the monitoring range (Figs. 9-13). It can be found that regular monitoring for the stability of centroids is necessary to comprehend centroid variations.ConclusionsWe report a laser spot centroid extraction method against complex background noise based on the footprint images collected by the TECM-1 satellite. Our method uses grayscale matching to remove most of the background noise from the spot image, followed by distance constraint, Gaussian filtering, and Otsu's image segmentation to remove the residual noise. The method ultimately calculates the centroid coordinates of the laser spot by the grayscale centroid method. Assessed by simulated and actual spot images of various terrain types, the results demonstrate that our method exhibits robust adaptability to laser spots in complex background scenarios and displays strong stability. However, for ground images with a significant number of saturated grayscale values, the present grayscale matching method cannot remove the background noise completely and it will affect the final centroid extraction accuracy. Future research should explore optimizing the grayscale transformation model or introducing other constraints to address this issue. The results of the stability analysis reveal a relatively tight jitter scope of centroids during the monitoring range, indicating a relatively stable geometric relationship between the laser and optical axis monitoring camera. Our study will be employed to support laser positioning, with the goal of enhancing the horizontal positioning precision of laser data.
Acta Optica Sinica
- Publication Date: Mar. 25, 2024
- Vol. 44, Issue 6, 0628005 (2024)
Pixel Extraction and Accuracy Verification of Optical Remote Sensing Satellite Based on Reflected Point Source
Qiang Wang, Weiwei Xu, Xiaolong Si, Xin Li, Baoyun Yang, and Liming Zhang
ObjectiveThe automation of calibration and the accuracy of pixel extraction are the key factors in improving the efficiency and accuracy of geometric calibration of optical remote sensing satellites in orbit. With the increasing number of optical remote sensing satellites in orbit and the continuous improvement of satellite image resolution, current level of calibration automation cannot meet future development needs. The coordinates of control points and their corresponding image points are input parameters for the geometric calibration of the camera. The accuracy of their measurement and extraction directly affects the accuracy and precision of the internal and external orientation element calibration of the satellite camera. The measurement accuracy of ground control points and on-orbit attitude has reached centimeter or even millimeter-level precision. However, the pixel extraction of control point images mainly relies on manual selection or pixel measurement algorithms, which cannot match the accuracy of control point measurements. Lightweight and automated quasi-stellar source-reflected point sources are proposed to be used as ground control points, along with an algorithm for matching pixel extraction from these sources. This will be combined with on-orbit calibration experiments based on reflected point sources to verify the accuracy of pixel extraction for optical remote sensing satellites. The objective of this paper is to improve the accuracy of pixel extraction, which in turn will enhance the geometric calibration and remote sensing image positioning accuracy of these satellites in orbit.MethodsFirst, we propose a Gaussian model-based method for pixel extraction from reflected point sources and a rational function model-based method for verifying the accuracy of pixel extraction. Based on these principles, we design an experiment to verify the accuracy of pixel extraction from reflected point sources. Second, we analyse the experimental image and extract the pixels by the reflected point source method. The accuracy of the extracted pixels is then verified by template matching and nonlinear optimization methods. Finally, we verify the accuracy of pixel extraction by the reflected point source method with a rational function model and calculate the accuracy of pixel positioning by the template matching method and nonlinear optimization method. A comparative verification of the reflected point source method is conducted.Results and DiscussionsThe pixel coordinates extracted by the reflected point source method, template matching method, and nonlinear optimization method are shown in Tables 1 and 4. The results of the three methods are relatively consistent. The differences between the extracted pixel coordinates and the mean values are shown in Table 5. The maximum error is 0.0472 pixel, which is better than 0.05 pixel, which verify the accuracy of the reflected point source method for the optical remote sensing satellite. The pixel extraction accuracy is better than that of square-shaped top-hat markers and manual extraction of natural features. The validation results of the rational function model are shown in Table 7. After the maximum value is removed, the positioning accuracy of the extracted pixel coordinates using the reflected point source method, template matching method, and nonlinear optimization method in the flight direction and sensor line array direction is better than 0.04 pixel, and the planar accuracy is better than 0.05 pixel, further verify the accuracy of pixel extraction using the reflected point source method. The experimental results preliminarily indicate that the reflected point source method can achieve high-precision remote sensing image pixel extraction and meet the application requirements of high-precision targets for the geometric calibration of optical remote sensing satellites.ConclusionsThe preliminary results of on-orbit tests based on reflected point sources for optical remote sensing satellites indicate that compared to conventional methods such as template matching, the reflected point source method has an extraction accuracy of better than 0.05 pixel, which is higher than that for natural objects and artificial targets. The rational function model parameters accompanying the remote sensing images are applied to verify the positioning accuracy of reflected point source method, which is better than 0.05 pixel. Automated reflected point source method not only enable high-precision pixel extraction but also combine the array configuration of point sources with the automatic measurement of atmospheric optical characteristics in the test area. Image quality evaluation and radiation calibration are achieved for optical remote sensing satellites. This can improve the efficiency and accuracy of on-orbit calibration for optical remote sensing satellites. Automated reflected point sources are expected to be networked and deployed within the field of view of optical remote sensing satellites, forming ground control points for on-orbit geometric calibration and enabling high-precision, high-frequency, and normalized geometric radiation calibration for optical remote sensing satellites. Our study provides a reference for automated calibration and accuracy improvement of domestic remote sensing satellites and is of great significance for improving the quantitative level and application of optical remote sensing satellite images. ObjectiveThe automation of calibration and the accuracy of pixel extraction are the key factors in improving the efficiency and accuracy of geometric calibration of optical remote sensing satellites in orbit. With the increasing number of optical remote sensing satellites in orbit and the continuous improvement of satellite image resolution, current level of calibration automation cannot meet future development needs. The coordinates of control points and their corresponding image points are input parameters for the geometric calibration of the camera. The accuracy of their measurement and extraction directly affects the accuracy and precision of the internal and external orientation element calibration of the satellite camera. The measurement accuracy of ground control points and on-orbit attitude has reached centimeter or even millimeter-level precision. However, the pixel extraction of control point images mainly relies on manual selection or pixel measurement algorithms, which cannot match the accuracy of control point measurements. Lightweight and automated quasi-stellar source-reflected point sources are proposed to be used as ground control points, along with an algorithm for matching pixel extraction from these sources. This will be combined with on-orbit calibration experiments based on reflected point sources to verify the accuracy of pixel extraction for optical remote sensing satellites. The objective of this paper is to improve the accuracy of pixel extraction, which in turn will enhance the geometric calibration and remote sensing image positioning accuracy of these satellites in orbit.MethodsFirst, we propose a Gaussian model-based method for pixel extraction from reflected point sources and a rational function model-based method for verifying the accuracy of pixel extraction. Based on these principles, we design an experiment to verify the accuracy of pixel extraction from reflected point sources. Second, we analyse the experimental image and extract the pixels by the reflected point source method. The accuracy of the extracted pixels is then verified by template matching and nonlinear optimization methods. Finally, we verify the accuracy of pixel extraction by the reflected point source method with a rational function model and calculate the accuracy of pixel positioning by the template matching method and nonlinear optimization method. A comparative verification of the reflected point source method is conducted.Results and DiscussionsThe pixel coordinates extracted by the reflected point source method, template matching method, and nonlinear optimization method are shown in Tables 1 and 4. The results of the three methods are relatively consistent. The differences between the extracted pixel coordinates and the mean values are shown in Table 5. The maximum error is 0.0472 pixel, which is better than 0.05 pixel, which verify the accuracy of the reflected point source method for the optical remote sensing satellite. The pixel extraction accuracy is better than that of square-shaped top-hat markers and manual extraction of natural features. The validation results of the rational function model are shown in Table 7. After the maximum value is removed, the positioning accuracy of the extracted pixel coordinates using the reflected point source method, template matching method, and nonlinear optimization method in the flight direction and sensor line array direction is better than 0.04 pixel, and the planar accuracy is better than 0.05 pixel, further verify the accuracy of pixel extraction using the reflected point source method. The experimental results preliminarily indicate that the reflected point source method can achieve high-precision remote sensing image pixel extraction and meet the application requirements of high-precision targets for the geometric calibration of optical remote sensing satellites.ConclusionsThe preliminary results of on-orbit tests based on reflected point sources for optical remote sensing satellites indicate that compared to conventional methods such as template matching, the reflected point source method has an extraction accuracy of better than 0.05 pixel, which is higher than that for natural objects and artificial targets. The rational function model parameters accompanying the remote sensing images are applied to verify the positioning accuracy of reflected point source method, which is better than 0.05 pixel. Automated reflected point source method not only enable high-precision pixel extraction but also combine the array configuration of point sources with the automatic measurement of atmospheric optical characteristics in the test area. Image quality evaluation and radiation calibration are achieved for optical remote sensing satellites. This can improve the efficiency and accuracy of on-orbit calibration for optical remote sensing satellites. Automated reflected point sources are expected to be networked and deployed within the field of view of optical remote sensing satellites, forming ground control points for on-orbit geometric calibration and enabling high-precision, high-frequency, and normalized geometric radiation calibration for optical remote sensing satellites. Our study provides a reference for automated calibration and accuracy improvement of domestic remote sensing satellites and is of great significance for improving the quantitative level and application of optical remote sensing satellite images.
Acta Optica Sinica
- Publication Date: Mar. 25, 2024
- Vol. 44, Issue 6, 0628004 (2024)
Lightweight Vector Control Library Technology for Spaceborne Positioning Accuracy Optimization of Optical Remote Sensing Satellites
Ming Li, Yang Dong, Dazhao Fan, Song Ji, Jiaxuan Song, and Ding Gao
ObjectiveWith the rapid development of optical remote sensing satellites in China, the types of satellites, imaging methods, and the number of satellites in orbit are constantly increasing. Intelligent remote sensing satellite (IRSS) and related surveying and mapping application services have become an important development direction in the field of remote sensing surveying and mapping. As a key technology, on-orbit geometric positioning is rapidly developed and has become one of the essential works for IRSS and its subsequent applications. To improve the positioning accuracy, at the same time, ground control information has to be injected into the spaceborne processing system. However, the data volume of ground control information is usually globally covered and is too huge to be directly loaded. How to lighten the ground control information, therefore, has become one of the urgent problems to be solved. The construction of an on-orbit control information library is one of the solutions. At present, most related methods are focused on the lightweight processing of control information descriptors, the performance of which is generally limited by environmental noise-affected feature diversity. To address the problem, scholars have proposed and attempted to introduce vector line features into the methods to improve its robustness. Based on this, we propose an optical remote sensing satellite positioning technology based on the lightweight vector control library, which uses the vector topology relationship to get rid of the dependence of the control point on local image grayscale information. We believe that our spaceborne lightweight vector control library can help IRSS improve on-orbit positioning accuracy and advance the development of on-orbit automatic processing technology.MethodsFirst, we extract and perfect the road information on the ground platform. Through a series of operations including road network refinement, node interruption, and road network topological relationship construction, the spaceborne lightweight vector control library is formed. Then, the road mask is extracted from the spaceborne intelligent processing module. After that, in the matching and positioning module, we propose the local vector construction method based on random walking for the unavoidable breakage phenomenon of road extraction in the spaceborne environment. Finally, we propose a hierarchical matching strategy based on the hidden Markov model (HMM) to accomplish the matching and use the offset of the matching transformation model to correct its rational polynomial coefficients (RPC) to improve the image positioning accuracy.Results and DiscussionsTo verify the effectiveness of the proposed method, we select three sets of data for testing: 1) high score No. 2 image and high score No. 7 image in Kaifeng City, Henan Province, China; 2) Jilin-1 video data and Google images in Juarez, USA; 3) Jilin-1 video data and Google images in Oklahoma City, USA. Random walk vector extraction is performed multiple times in the three sets of data, and the average number of vector nodes extracted is 13, 7, and 5 respectively (Table 1). In addition, we compare the storage capacity of this method with traditional image control points, lightweight image control points, and deep lightweight image control points method. After comparison, the storage capacity of this method is reduced by 83334.0 times, 252.6 times, and 2.3 times compared to that of the other three methods (Table 2). In the vector matching stage, the proposed methods successfully match the lightweight vector library and the random walk vector. The number of vector nodes successfully matched in the three groups of regions is 17, 21, and 5, and the encryption points are 4372, 4245, and 5591 respectively. The test results all meet the minimum requirements for the number of points for the control point to correct the image positioning accuracy. Therefore, our method is feasible and effective for correcting the image positioning accuracy. Then, we use the successfully matched vector nodes and encryption points to correct the image RPC and compare the positioning accuracy of the original image. The results show that by correcting the RPC through the proposed method, the image localization accuracy of each region is significantly improved. Specifically, the positioning accuracy of Jilin No. 2 has been increased from 79 pixel to about 4 pixel, that of Jilin-1 video data in region 2 has been increased from 675 pixel to about 16 pixel, and that of Jilin-1 video data in region 3 has been increased from 539 pixel to about 17 pixel (Table 2). Through above tests, it is verified that the proposed method can effectively improve the positioning accuracy of non-measurable optical remote sensing satellite images.ConclusionsGiven the urgent demand for spaceborne lightweight control data required of intelligent remote sensing satellite systems, we design a spaceborne lightweight vector control library. Compared with traditional control point methods, the proposed vector control library uses only the geographic coordinates and topological relationship of the control points to complete the image positioning without descriptors of local images or image points. Experiments such as vector construction, vector matching, and positioning accuracy comparison are conducted on the proposed method through multiple sets of image data to verify the matching effectiveness of the lightweight vector control library and its ability to improve positioning performance. This leads to the conclusion that the lightweight vector control library can provide high-precision global positioning information for intelligent remote sensing satellite systems and provide data support for applications such as on-orbit earth positioning and geometric correction. ObjectiveWith the rapid development of optical remote sensing satellites in China, the types of satellites, imaging methods, and the number of satellites in orbit are constantly increasing. Intelligent remote sensing satellite (IRSS) and related surveying and mapping application services have become an important development direction in the field of remote sensing surveying and mapping. As a key technology, on-orbit geometric positioning is rapidly developed and has become one of the essential works for IRSS and its subsequent applications. To improve the positioning accuracy, at the same time, ground control information has to be injected into the spaceborne processing system. However, the data volume of ground control information is usually globally covered and is too huge to be directly loaded. How to lighten the ground control information, therefore, has become one of the urgent problems to be solved. The construction of an on-orbit control information library is one of the solutions. At present, most related methods are focused on the lightweight processing of control information descriptors, the performance of which is generally limited by environmental noise-affected feature diversity. To address the problem, scholars have proposed and attempted to introduce vector line features into the methods to improve its robustness. Based on this, we propose an optical remote sensing satellite positioning technology based on the lightweight vector control library, which uses the vector topology relationship to get rid of the dependence of the control point on local image grayscale information. We believe that our spaceborne lightweight vector control library can help IRSS improve on-orbit positioning accuracy and advance the development of on-orbit automatic processing technology.MethodsFirst, we extract and perfect the road information on the ground platform. Through a series of operations including road network refinement, node interruption, and road network topological relationship construction, the spaceborne lightweight vector control library is formed. Then, the road mask is extracted from the spaceborne intelligent processing module. After that, in the matching and positioning module, we propose the local vector construction method based on random walking for the unavoidable breakage phenomenon of road extraction in the spaceborne environment. Finally, we propose a hierarchical matching strategy based on the hidden Markov model (HMM) to accomplish the matching and use the offset of the matching transformation model to correct its rational polynomial coefficients (RPC) to improve the image positioning accuracy.Results and DiscussionsTo verify the effectiveness of the proposed method, we select three sets of data for testing: 1) high score No. 2 image and high score No. 7 image in Kaifeng City, Henan Province, China; 2) Jilin-1 video data and Google images in Juarez, USA; 3) Jilin-1 video data and Google images in Oklahoma City, USA. Random walk vector extraction is performed multiple times in the three sets of data, and the average number of vector nodes extracted is 13, 7, and 5 respectively (Table 1). In addition, we compare the storage capacity of this method with traditional image control points, lightweight image control points, and deep lightweight image control points method. After comparison, the storage capacity of this method is reduced by 83334.0 times, 252.6 times, and 2.3 times compared to that of the other three methods (Table 2). In the vector matching stage, the proposed methods successfully match the lightweight vector library and the random walk vector. The number of vector nodes successfully matched in the three groups of regions is 17, 21, and 5, and the encryption points are 4372, 4245, and 5591 respectively. The test results all meet the minimum requirements for the number of points for the control point to correct the image positioning accuracy. Therefore, our method is feasible and effective for correcting the image positioning accuracy. Then, we use the successfully matched vector nodes and encryption points to correct the image RPC and compare the positioning accuracy of the original image. The results show that by correcting the RPC through the proposed method, the image localization accuracy of each region is significantly improved. Specifically, the positioning accuracy of Jilin No. 2 has been increased from 79 pixel to about 4 pixel, that of Jilin-1 video data in region 2 has been increased from 675 pixel to about 16 pixel, and that of Jilin-1 video data in region 3 has been increased from 539 pixel to about 17 pixel (Table 2). Through above tests, it is verified that the proposed method can effectively improve the positioning accuracy of non-measurable optical remote sensing satellite images.ConclusionsGiven the urgent demand for spaceborne lightweight control data required of intelligent remote sensing satellite systems, we design a spaceborne lightweight vector control library. Compared with traditional control point methods, the proposed vector control library uses only the geographic coordinates and topological relationship of the control points to complete the image positioning without descriptors of local images or image points. Experiments such as vector construction, vector matching, and positioning accuracy comparison are conducted on the proposed method through multiple sets of image data to verify the matching effectiveness of the lightweight vector control library and its ability to improve positioning performance. This leads to the conclusion that the lightweight vector control library can provide high-precision global positioning information for intelligent remote sensing satellite systems and provide data support for applications such as on-orbit earth positioning and geometric correction.
Acta Optica Sinica
- Publication Date: Mar. 25, 2024
- Vol. 44, Issue 6, 0628003 (2024)
Topics
© Copyright 2018-2021 | Chinese Laser Press. All Rights Reserved 沪ICP备15018463号-20